4aAA10 – Acoustic Effects of Face Masks on Speech: Impulse Response Measurements Between Two Head and Torso Simulators

Victoria Anderson – vranderson@unomaha.edu
Lily Wang – lilywang@unl.edu
Chris Stecker – cstecker@spatialhearing.org
University of Nebraska Lincoln at the Omaha Campus
1110 S 67th Street
Omaha, Nebraska

Popular version of 4aAA10 – Acoustic effects of face masks on speech: Impulse response measurements between two binaural mannikins
Presented Thursday morning, December 2nd, 2021
181st ASA Meeting
Click here to read the abstract

Due to the COVID-19 Pandemic, masks that cover both the mouth and nose have been used to reduce the spread of illness. While they are effective at preventing the transmission of COVID, they have also had a noticeable impact on communication. Many find it difficult to understand a speaker if they are wearing a mask. Masks effect the sound level and direction of speech, and if they are opaque, can block visual cues that help in understanding speech. There are many studies that explore the effect face masks have on understanding speech. The purpose of this project was to begin assembling a database of the effect that common face masks have on impulse responses from one head and torso simulator (HATS) to another. Impulse response is the measurement of sound radiating out from a source and how it bounces through a space. The resulting impulse response data can be used by researchers to simulate masked verbal communication scenarios.To see how the masks specifically effect the impulse response, all measurements were taken in an anechoic chamber so no reverberant noise would be included in the impulse response measurement. The measurements were taken with one HATS in the middle of the chamber to be used as the source, and another HATS placed at varying distances to act as the receiver. The mouth of the source HATS was covered with various face masks: paper, cloth, N95, nano, and face shield. These were put on individually and in combination with a face shield to get a wider range of potential masked combinations that would reasonably occur in real life. The receiver HATS took measurements at 90° and 45° from the source, at distances of 6’ and 8’. A sine sweep, which is a signal that changes frequency over a set amount of time, was played to determine the impulse response of each masked condition at every location. The receiver HATS measured the impulse response in both right and left ears, and the software used to produce the sine sweep was used to analyze and store the measurement data. This data will be available for use in simulated communication scenarios to better portray how sound would behave in a space when coming from a masked speaker.

masks masks head and torso simulator (HATS) masks


5pAAa4 – The clapping circle “squeak,” finally explained

“The clapping circle “squeak,” finally explained”

Elspeth Wing – winge@purdue.edu
Steven Herr – sherr@purdue.edu
Alexander Petty – petty14@purdue.edu
Alexander Dufour – adufour@purdue.edu
Frederick Hoham – fhoham@purdue.edu
Morgan Merrill – mmerril@purdue.edu
Donovan Samphier – dsamphie@purdue.edu
Weimin Thor – wthor@purdue.edu
Kushagra Singh – singh500@purdue.edu
Yutong Xue – xyt@alumni.purdue.edu
Davin Huston – dhhustion@purdue.edu
Stuart Bolton – bolton@purdue.edu

Purdue University
610 Purdue Mall
West Lafayette, IN 47907

Popular version of paper 5pAAa4 (your paper version)
Presented Friday morning, December 11, 2020
179th ASA Meeting, Acoustics Virtually Everywhere

Ask any member of the Purdue University community about the “Clapping Circle,” and they will eagerly tell you about the unforgettable squeak that appears to materialize out of thin air when you stand in the middle of it and clap your hands. In 2019, the Purdue student chapter of the Acoustical Society of America gathered a team of undergraduate students, graduate students, and faculty to conduct a study to establish, once and for all, the specific acoustic mechanisms behind “the squeak.”

An aerial photo of the Clapping Circle

An aerial photo of the Clapping Circle


A recording of the clap and subsequent squeak

The Clapping Circle is a circular plaza consisting of sixty-six concentric rings of stone tiles, and with stone benches on its edges. This architectural feature has led to numerous theories from acoustics experts about the cause: from reflections off the ground tiles, to the surrounding benches, or even the surrounding trees and buildings.

The members of the Purdue student chapter of the ASA decided to thoroughly investigate. They set up a multidirectional speaker in the middle to simulate a clap at different heights, and then recorded the results through a microphone. They even covered the entire circle in moving blankets to act as a control.

A photograph of the speaker and microphone in the middle of the circle during testing

A photograph of the speaker and microphone in the middle of the circle during testing

The experiments confirmed their theory: two phenomena known as “acoustical diffraction grating” and “repetition pitch”  combined to create the effect.  Acoustical diffraction grating refers to the reinforcement of certain frequencies produced by a reflection, which they theorized was coming from the progressively more distant bevels between the ground tiles. “Repetition pitch” refers to the ear’s processing of repeated percussive sounds as a pitch. Put both of these together, and you get a rapidly descending pitch which sounds like a squeak.

When they covered the circle with hundreds of moving blankets, the squeak disappeared – ultimately proving their theory correct.

While similar studies have been performed at stepped architectural features (such as the pyramid at Chichen-Itza), this is the most completely researched explanation of the “clapping circle” phenomenon.  And now, thanks to these diligent acoustics students, the tour guides at Purdue University will have a proper scientific explanation for “the squeak!”

Some of the investigation team at the site

Check out the video link below to a promotional video about the project created by Purdue University

Video: https://www.youtube.com/watch?v=Cuv1Pd_hS_I

More information: https://www.purdue.edu/newsroom/stories/2020/Stories%20at%20Purdue/explaining-the-sound-of-purdues-clapping-circle.html

1aAAa2 – Flooring Impact Sound – A Potential Path to Quieter Hospitals

Mike Raley – mike.raley@ecoreintl.com
Ecore International
715 Fountain Avenue
Lancaster, PA 17601

Popular version of paper 1aAAa2
Presented Monday morning, December 7, 2020
179th ASA Meeting, Acoustics Virtually Everywhere

Hospitals are noisy places. The Hospital Consumer Assessment of Healthcare Providers and Systems (HCAHPS) surveys patients’ perception of their hospital care. Consistently, the quietness of the hospital is one of the lowest scores in the survey. If you have ever spent time in a hospital, that is likely no surprise.

What might be surprising is that a recent study by Bliefnick et al. showed that the acoustic metrics we typically use to evaluate noise in hospitals are not well-correlated with HCAHPS scores. Interestingly, they found that peak occurrence rates, how often a loud sound was above a certain threshold, were well-correlated with HCAHPS scores. In another recent study, Park et al. found that footsteps were a top five contributor to perceived loudness peaks, noise events that are significantly louder than the sound level before and after the event. Along with anecdotal evidence from healthcare designers, these two studies indicate that footsteps could contribute to a patient’s perception of quietness, and reducing noise from footsteps could improve that patient experience.

Test standard ASTM E3133 measures floor impact sound radiation in the space where the impact occurs. This differs from the common impact insulation class (IIC) standard (ASTM E492) that measures impact sound in the room below where the impacts occur.

(1aAAa2_Fig1_ImpactFoot.jpg)

Using ASTM E3133 we can compare floor impact sound levels for flooring common to hospitals, such as VCT and standard sheet vinyl, as well as specialty acoustical flooring like sheet vinyl fusion bonded to a rubber backing (Vinyl Rx).

(1aAAa1_Fig2_FlooringComparison)

Figure 2 shows that the Vinyl Rx can significantly reduce floor impact radiated sound, with a 13dB reduction in the overall sound level compared to VCT (a ~60% reduction in perceived loudness). The significant reduction in impact sound levels gives us an exciting indicator that specialty acoustical flooring has the potential to reduce predicted loudness peaks and improve the patient experience.

Unfortunately, there are some issues with the ASTM test method that limit its usefulness. In the course of testing to ASTM E3133, we uncovered substantial variation in the sound levels measured using two standard tapping machines from different manufacturers. The variation in tapping machines is evident even on a loud floor like concrete (see Figure 3).

(1aaAAa2_Fig3_BareConc)

The standard has provisions to account for the self-noise of the tapping machine, but those provisions do not correct the discrepancy between the two machines. Further investigation has shown that different flooring actually changes the self-noise of the tapping machine, so it cannot be easily accounted for.

While it may be possible to modify tapping machines to address the variation in self-noise, the most likely solution to the problem is a different impact source. Impact sources like golf balls, cue balls, and ball bearings can create consistent impacts without the self-noise issues of standard tapping machines. These objects are also readily available and easily transportable, so they lend themselves well to field measurements.

2aAA10 – Developing A New Method for Analyzing Room Acoustics Based on Auralization “How can a room shape your voice?” 

Alaa Algargoosh – alaas@umich.edu
John Granzow– jgranzow@umich.edu
University of Michigan
500 S State St
Ann Arbor, MI 48109

Popular version of paper 2aAA10 Developing A New Method for Analyzing Room Acoustics Based on Auralization
Presented Tuesday morning, 8:00 AM – 11:40 AM, December 03, 2019
178th ASA Meeting, San Diego, CA

A sound may interact with the geometry of a room to produce resonances. These resonances or modes arise when a room’s dimensions reinforce certain frequencies in the sound source. This phenomenon is considered problematic in recording studios or concert halls where it may color the sound in unintended ways. To mitigate this, researchers have developed methods to calculate the modes and diminish their effects.

Alternatively, worship spaces may benefit from such resonances if they provoke a sense of the numinous as the voice accumulates into reinforced frequency bands. Examples of this may extend into pre-history; researchers in archeoacoustics, for example, have found that many of the paintings in ancient caves were located in areas with strong resonances that may have played a role in ritual [1].

In the Hagia Sophia, an architectural marvel that was historically used as a worship space in Turkey, specific frequencies are also amplified by the accumulation of the sound energy interacting with the architectural dimensions and materials. Resonances at low frequencies cause the sound level to increase above the original sound source after the onset [2].

Among the complex factors that give rise to these acoustic qualities in worship spaces, we are interested in examining the contribution of architectural geometries and materials, how they reinforce specific ranges of frequencies and cultural contexts in which such phenomena might be desirable or serve a musical function.

To listen to such cumulative effects of these resonances, we were particularly inspired by Alvin Lucier’s famous piece, I am sitting in a room, where the composer records his voice, plays it back into the room, and re-records the payback iteratively. Over time, Lucier’s process amplifies the frequencies within his voice that correspond to the resonances of the room. By the end of the piece, Lucier’s words have transformed into a prosodic ringing of room modes. A similar approach (although much faster) is used in the testing of live-sound systems; feedback loops are created to identify frequencies that will cause ringing within a given space.

Our research draws from these examples to investigate analogous results within a simulated framework. Accordingly, a room is modeled, an impulse response (IR) that captures the room’s acoustic features is generated, and an auralization is created by shaping the voice recording based on the sound signature of the simulated room, a process called convolution. The output is then used as an input that is convolved again with the same simulated room.

auralization

Figure 1: A multiple auralization method combining the room sound signature and the voice recording to create

Adopting this method allows us to amplify and auralize some of the effects that occur at specific frequency ranges in the presence of  sustained sounds. The method overcomes some of the challenges of traditional calculation methods of room modes, which are limited to regular shape rooms and often neglect the surface material and sound source in the analysis.

References:
[1] Lubman, D. (2017). Did Paleolithic cave artists intentionally paint at resonant cave locations? The Journal of the Acoustical Society of America, 141(5), 3999-4000. doi:10.1121/1.4989168

[2] Pentcheva, B. (2017). Aural Architecture in Byzantium: Music, Acoustics, and Ritual: Taylor & Francis.

3pAA4 – Small town factory into modern multi-purpose music hall

David Manley – dmanley@dlrgroup.com
Rolando De La Cruz – rdelacruz@dlrgroup.com

DLR Group
6457 Frances Street
Omaha, NE 68106

Popular version of paper 3pAA4
Presented Wednesday afternoon, December 4, 2019
178th ASA Meeting, San Diego, CA

A former oil boomtown, El Dorado, Arkansas has a rich history, unique historic architecture, and a well-established arts and entertainment community, which includes the South Arkansas Symphony Orchestra, the South Arkansas Arts Center, and numerous successful music festivals. Community leaders sought to develop these assets into a regional draw and community anchor. The intent is to improve the quality of life and re-brand the community as a cultural performance mecca, while also slowing the decline in population (currently at 18,500) and revitalizing the local economy.

DLR Group’s master plan and design leverages existing historic assets, including the National Register-listed Griffin Auto Building, five other legacy structures, and new construction, to create a multi-venue downtown arts and entertainment district that preserves and celebrates the unique identity of El Dorado while appealing to contemporary audiences and future generations.

Implemented in phases, the project encompasses a 125,868 SF site and comprises a 7,000-patron festival venue/amphitheater, a 2,000-seat indoor music venue, a 100-seat black box/multi-purpose room, an 850-seat multi-use theater, a restaurant/club with stage, a visual arts facility, a farmers’ market, a children’s activity center, a park, and considerable site improvements for festivals along with new structures to support that use.

Phase 1 transformed the historic Griffin Auto Building (two-level, historic filling station, automotive showroom/repair shop) into a restaurant and flat-floor, indoor music venue. The warehouse was converted to an 1,800 seat (2,400 max. standing capacity) music venue.

Controlling the reverberation time, the time it takes sound to decay 60 decibels in a space, was critical to the acoustical success of the music venue. At over 18,000 square feet of floor space and nearly 600,000 cubic feet of volume, and constructed of concrete, metal deck, and masonry walls, the existing warehouse reverberation time was over 10 seconds long.

With a desired program of top tier modern amplified shows including rock and roll, country, and comedic talent, plus the South Arkansas Symphony Orchestra, the design goal for the renovated warehouse was 1.5 seconds in reverberation time.

Achieving this goal required ample use of acoustically absorptive material. After renovations to ensure the structural integrity of the existing roof were completed, and fireproofing was applied, 75% of the 30-foot-high and 96-foot-wide barrel-vaulted ceiling was covered with four-inch-thick fabric wrapped fiberglass panels. On lower walls, perforated metal panels were used for impact protection with fiberglass insulation behind for acoustical absorption. A total of almost 20,000 square feet of acoustically absorptive material was added to the warehouse.

File missing (1-RTGraph.jpg)
Figure 1 – Reverberation time calculation comparison of the existing and proposed treated Warehouse

The open-air filling station was enclosed by a glass curtain wall and converted to a restaurant dining area with stage for performance of live music. Separating the two music venues, the showroom was partly converted to a commercial kitchen to serve the restaurant dining area, and partly converted to a VIP area for events.

​2-HistoricFilingStation.jpg

Figure 2 – Photo of Historic Filing Station, circa 1928

3-PreRenoFilingStation.jpg

Figure 3 – Photo of pre-renovation Filing Station used as covered parking in 2014

4-FilingStationRestaurant.jpg

Figure 4 – Photo of post-renovation Filing Station used as a Restaurant in 2019

5-HistoricWarehouse.jpg

Figure 5 – Photo of Historic Warehouse Floor, circa 1928

6-PreRenoWarehouse.jpg

Figure 6 – Photo of pre-renovation Warehouse floor in 2014

7-WarehouseMusic1.jpg - music hall

Figure 7 – Photo of post-renovation Warehouse floor and stage used as a music venue in 2019

8-WarehouseMusic2.jpg - music hall

Figure 8 – Photo of post-renovation Warehouse Floor used as a music venue in 2019 with seats

2pAA13 – Reverberation Time Slope Ratio Thesis

Michael Fay – mfay.gracenote@gmail.com
GraceNote Design Studio
7046 Temple Terrace St.
San Diego, CA 92119

Presented Tuesday afternoon, December 3, 2019
178th ASA Meeting, San Diego, CA

The T60 Slope Ratio thesis defines specific reverberation time vs. frequency goals for modern architectural acoustic environments. It is offered to advance and define a room’s acoustic design goals, and provide a simple numeric scoring scale, and adjunct grade, from which acoustical design specifications can be initiated and/or evaluated. The acronym for reverberation time is T60.

The thesis outlines a proposed standard that condenses six octaves (63 Hz – 2 kHz) of reverberant decay-time data into a single numeric score for grading indoor performance, worship and entertainment facilities. Specifically, it’s a defining metric for scoring and grading the relationship (i.e. ratio) between the longest and shortest of the six T60 values — be they measured or predicted.

Beranek’s classical Bass Ratio goals and calculations were developed to support the idea that acoustic instruments need a little extra support, via longer reverberation times, in the low-frequency range.

The modern T60 Slope Ratio goals and calculations advance the notion that those same low frequencies don’t require extra time, but rather need to be well contained. Longer low and very low-frequency (VLF) T60s are not needed or desirable when an extended-range sound reinforcement system is used.

Slope Ratio

Slope Ratio
Figure 2: Graphic Examples of 5 T60 Measurements

The T60 Slope Ratio is calculated by dividing the longest time by the shortest time, regardless of frequency. An optimal score has a ratio between 1.10 and 1.20.

The proposed scoring and grading scale is defined by six numeric scoring tiers from 1.00 to 1.70 and above, and five grading adjectives from Optimal to Bad. See Figure 3.

Slope Ratio
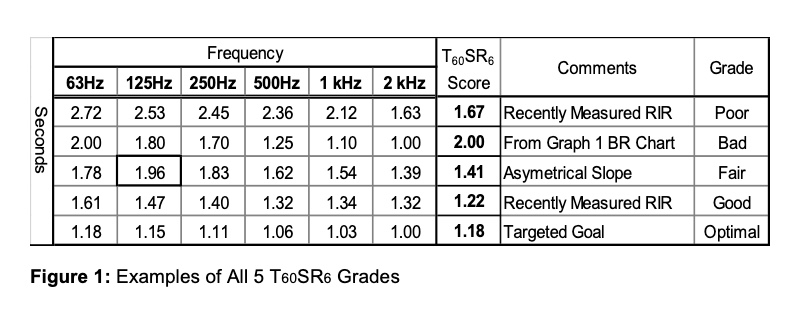
These modern applications would benefit from an optimal T60SR6 grade:
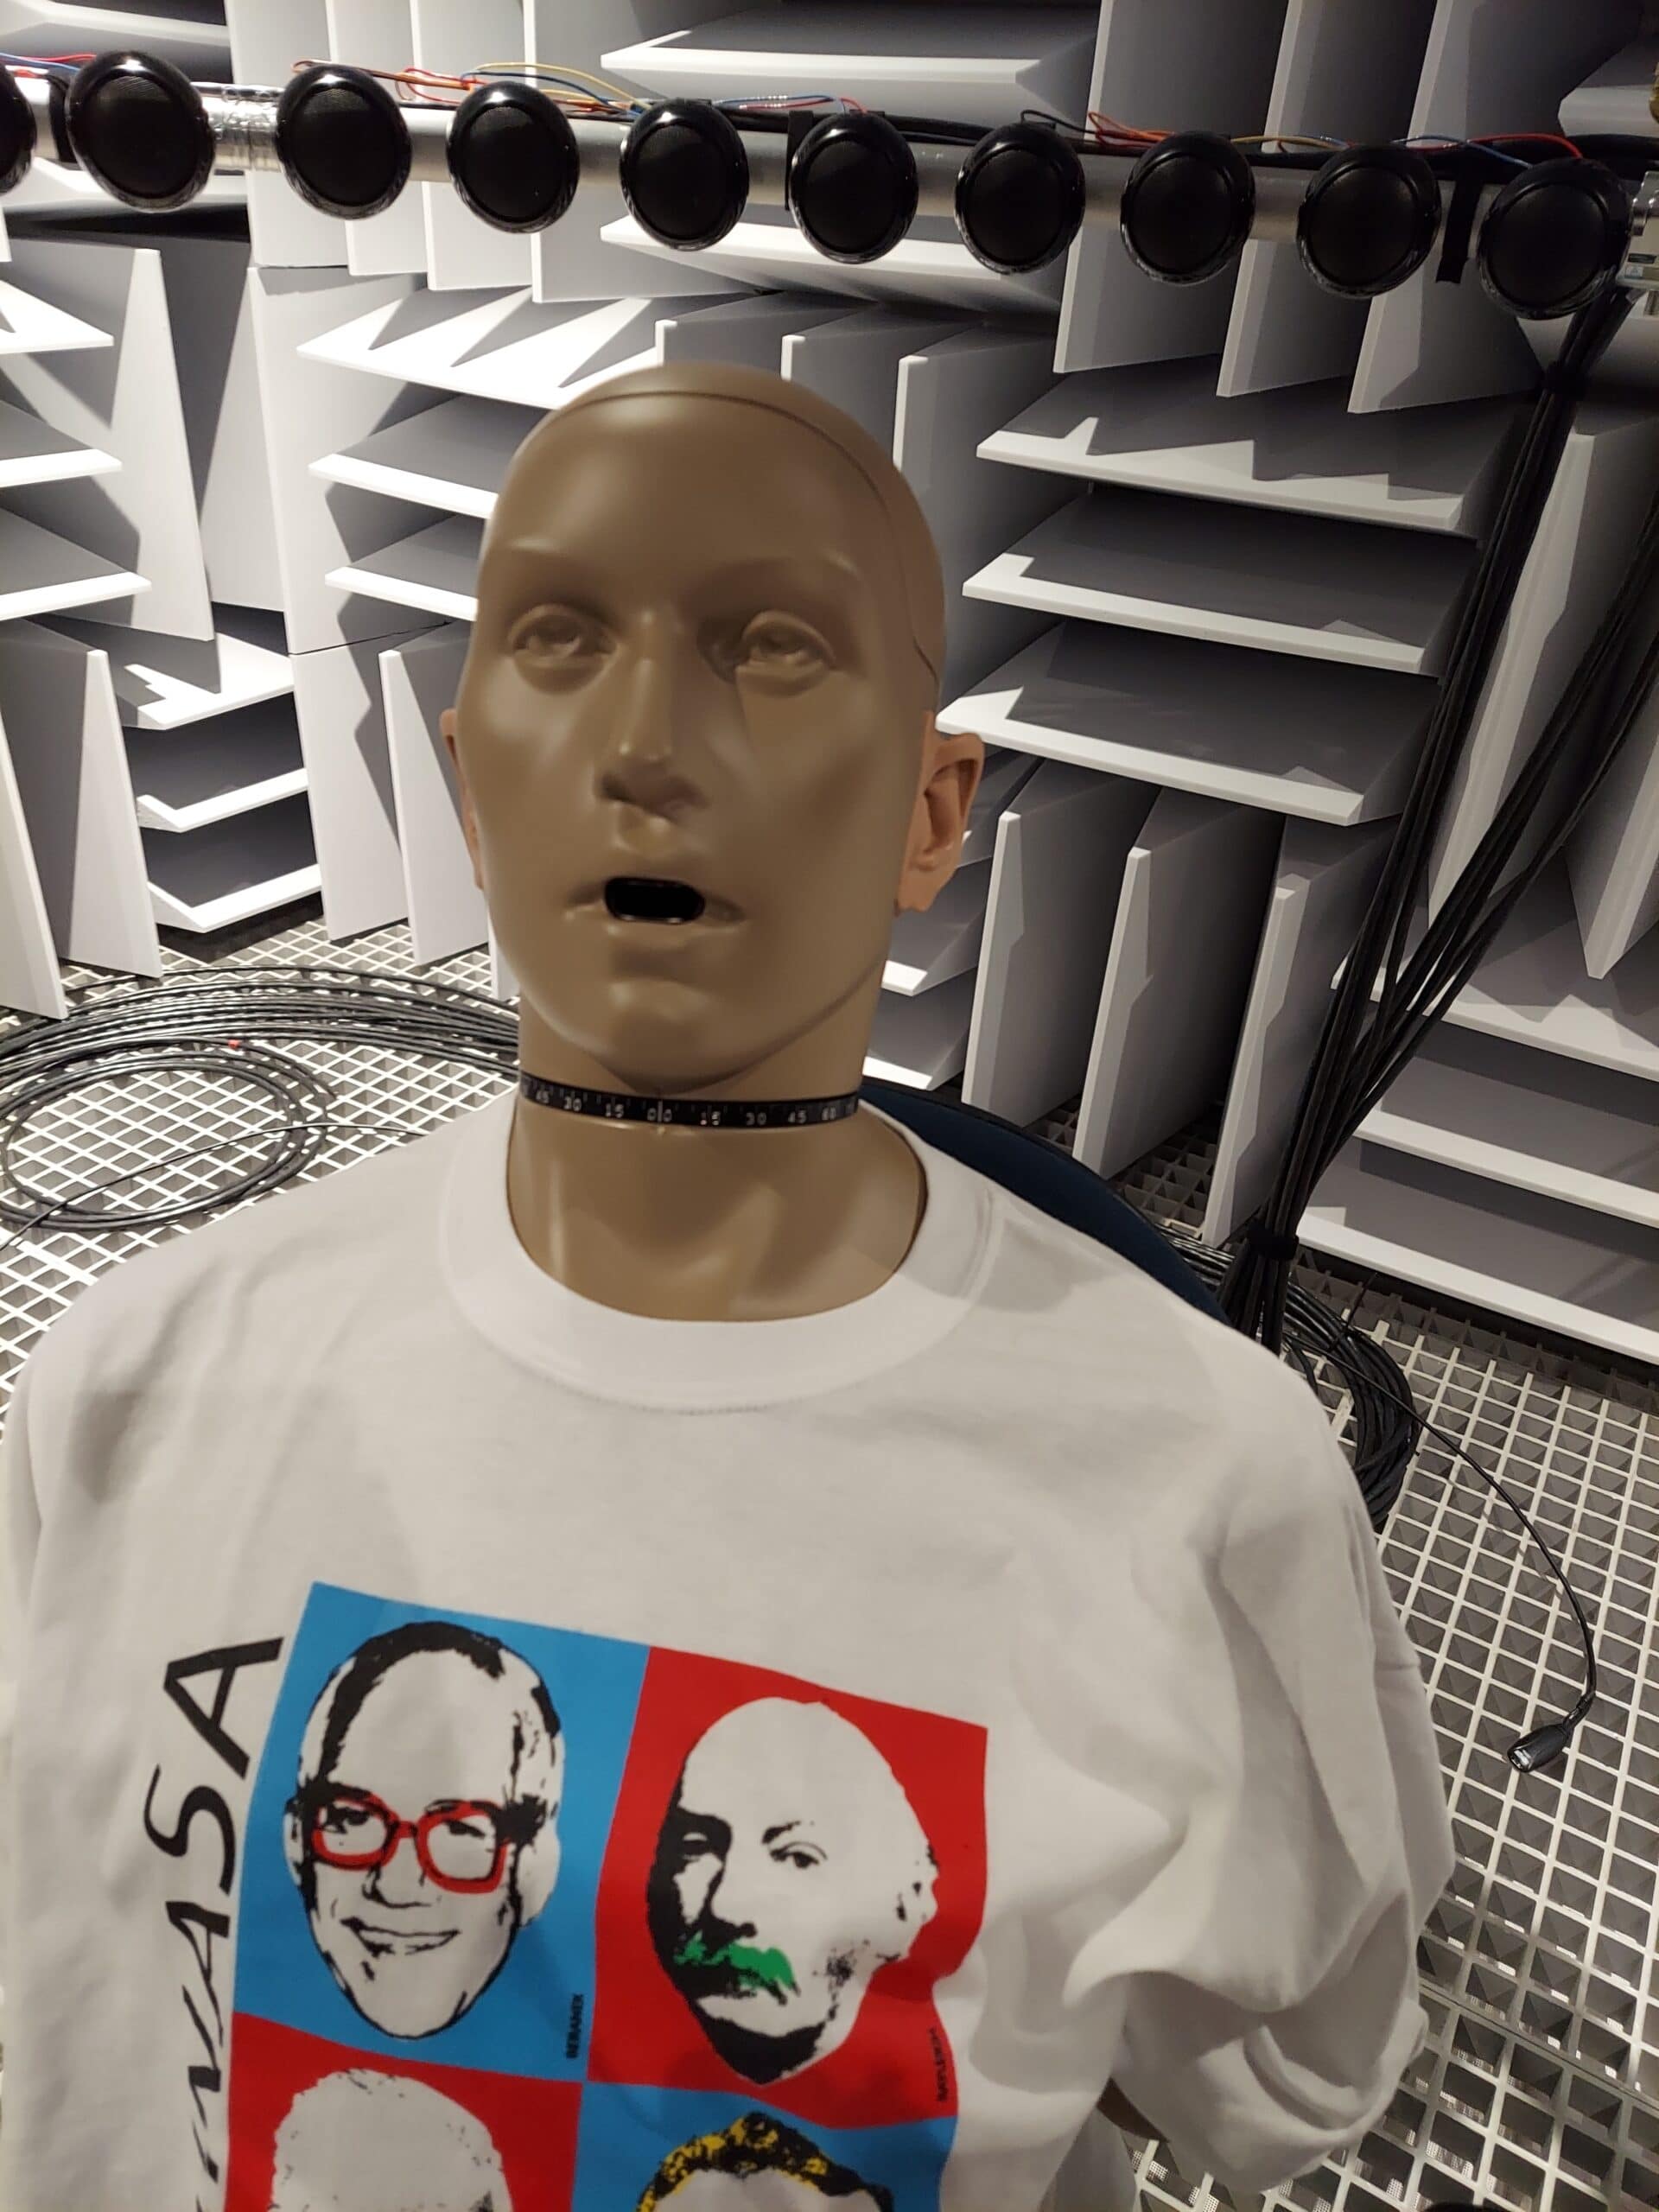
♣ Performing Arts Venues
♣ Contemporary Worship Facilities
♣ Venues with Electro-acoustical Enhancement Systems
♣ Large Rehearsal Rooms

Modern VLF testing standards and treatments are lacking:
♣ The ANSI and ISO standards organizations need to develop new guidelines and standards for testing VLF absorption products and integration options.
♣ Manufacturers should make new VLF treatment products an R&D priority.

More than one hundred years ago Walter Sabine, the father of classical architectural acoustics, was concerned that music halls would soak up too much of the low-frequency energy being produced by acoustic instruments, causing audiences to complain that the music lacked body. However today, most musical styles, venues, technology, and consumer tastes and expectations have advanced far beyond anything relevant to Sabine’s concern.

The Slope Ratio Postulate: Modern loudspeakers are designed and optimized to perform as flat, or nearly flat, audio output devices. Therefore, why aren’t acousticians designing a nearly-flat T60 response for rooms in which these loudspeakers operate?