3pNS3 – Design of an Electric Vehicle Warning Sound System to Minimize Noise Pollution

Nikolaos Kournoutos – nk1y17@soton.ac.uk
Jordan Cheer – J.Cheer@soton.ac.uk
Institute of Sound and Vibration Research,
University of Southampton
University Rd
Southampton, UK SO17 1BJ

Popular version of paper 3pNS3 “Design and realisation of a directional electric vehicle warning sound system
Presented 1:45pm, December 4, 2019
178th ASA Meeting, San Diego, CA
Read the article in Proceedings of Meetings on Acoustics

Electric cars are rather quiet when compared to their internal combustion counterparts, and this has sparked concern regarding the hazards this might impose on pedestrians and other vulnerable road users. As a result, regulations are coming into effect necessitating the adoption of artificial warning sounds by all electric cars. At the same time however, there have been numerous critics of this decision, citing the resulting increase in noise pollution it might bring about, along with all of its negative side effects.

Researchers have developed systems that are capable of focusing the emitted warning sounds at specific directions, in order to avoid any unnecessary emissions to the surrounding environments. Loudspeaker array based systems have been successful in that regard, managing to target individual pedestrians with the emitted warning sounds. However, the high manufacturing and maintenance costs have kept such solutions from being widely adopted.

In this project, we suggest a directional sound system, which instead of loudspeakers, utilizes an array of structural actuators. These actuators are capable of transmitting vibrations to the structure upon which they are attached, and cause it to radiate sound – effectively using the structure itself as a loudspeaker cone. Like with loudspeakers, one can control the phase and amplitude of each actuator in the array, so that the resulting vibration of the structure radiates sound towards a desired direction.

The first validation of the proposed system was performed using an actuator array attached on a simple rectangular panel. Measurements taken in an anechoic chamber indicate that the structural actuator array is indeed capable of directional sound radiation, within a frequency range defined by the physical characteristics of the vibrating structure.

Picture 1: The prototype used for evaluation consisted of a rectangular aluminum panel, and an array of six actuators attached to it.

The next step was to test how the system performs when implemented in an actual car. The geometry and different materials used in the components of a car mean that the performance of the system greatly depends on where the array is placed. We found that for the warning sounds we used in our tests, the best position for our array was the front bumper, which ensured good forward directivity, and reasonable sound beam steering capabilities.

 Electric Vehicle

Picture 2: The actuator array attached to a car for testing in a semi-anechoic environment.

Picture 3: Examples of the directivity achieved for different steering settings, when the actuator array is attached to the front bumper of the car. MATLAB Handle Graphics

Overall, results of our research show that a system based on structural actuators can generate controllable directional sound fields. More importantly, such a solution would be easier to implement on cars as it is more durable and requires no modifications. Wide adoption of such a system could ensure that electric cars can safely project an auditory warning without causing unnecessary noise pollution to the environment.

4pPPb2 – Phantom words are heard more frequently as coming from the right side of space

Diana Deutsch – ddeutsch@ucsd.edu
Dept. of Psychology,
University of California, San Diego,
La Jolla, CA , 92093, USA

Kevin Dooley
Dept. of Psychology,
California State University, Dominguez Hills,
Carson, CA, 90747, USA

Trevor Henthorn
Dept. of Music,
University of California, San Diego,
La Jolla, CA, 92093, USA

Popular version of paper 4pPPb2
Presented Thursday afternoon, Dec 5, 2019
178th ASA Meeting, San Diego, CA

When we listen to speech, we draw on an enormous amount of experience to make inspired guesses as to what’s being said. But this very process of guesswork can lead us to perceive words and phrases that are not, in fact, being spoken. This paper reports a study in which two sequences of words arise simultaneously from different regions of space. The subject sits in front of two loudspeakers, with one to his left and the other to his right. A sequence is played consisting of two words, or a single word that is composed of two syllables, and these are repeated continuously. The same sequence is presented via both loudspeakers, but the sounds are offset in time, so that when one sound (word or syllable) is coming from the speaker on the left, the other sound is coming from the speaker on the right.

On listening to such a sequence, people often begin by hearing a jumble of meaningless sounds, but after a while distinct words and phrases emerge perceptually. Those that are heard as from the speaker on the left often appear different from those heard as from the speaker from the right. Later, different words and phrases emerge. In addition, people often hear a third stream of words or phrases, apparently coming from some location between the two speakers. Nonsense words, and musical, often rhythmic sounds, sometimes seem to be mixed in with the meaningful words.

People often report hearing speech in strange or “foreign” accents—presumably they are perceptually organizing the sounds into words and phrases that are meaningful to them, even though they seem to be distorted in consequence. To give an example of the variety of words that people hear when listening to these sounds, here are some reports from students in one class that I teach at UCSD, when presented continuously with the word nowhere.

window, welcome, love me, run away, no brain, rainbow, raincoat, bueno, nombre, when oh when, mango, window pane, Broadway, Reno, melting, Rogaine.

Click here (MP3 file) to listen to a phantom word

Click here to listen to another phantom word

It has been shown that, in listening to speech, most righthanders tend to focus more on the right side of space, which is represented primarily in the left hemisphere. However, non-righthanders are more varied in the direction of their focus. So we surmised that righthanders would perceive more phantom words and phrases as though coming from their right, and that non-righthanders would not show this difference in perceived location. To ensure that any effect of spatial location could not be attributed to a difference in loudspeaker characteristics, we divided our subject population into two handedness groups – righthanders and non-righthanders – and for each group half of the listeners were seated facing forward – that is, toward the speakers – and the other half were facing backward. The subjects were asked to write down each new word or phrase when they heard it, and to indicate whether it appeared to be coming from their left, from their right, or from somewhere between the speakers.

Forty UCSD students served as subjects. These were twenty righthanders and twenty non-righthanders. The righthanders were 5 male, and 15 female, with an average age of 21 years and 5 years of musical training. The non-righthanders were also 5 male and 15 female, with an average age of 22 years and 6.6 years of musical training. Our results showed no effect of age, musical training, or gender.

phantom words setup

Setup in study exploring the number of phantom words heard as from the left, center, and right.

Figure 1 shows the setup for the experiment. Seven phantom word sequences were presented, separated by 30 sec. pauses.

phantom words reported

Average number of phantom words reported for each sequence, classified by the direction from which the phantom word appeared. The data from the forward-facing subjects are here presented.

Figure 2 shows, for the forward-facing subjects, the average number of phantom words that were reported for each sequence, classified by whether the phantom word was perceived as coming from the left, from the right, or as centered between the speakers. As shown here, the righthanders reported more phantom words as from the right, and this difference in perceived location was highly significant. In contrast, the non-righthanders showed no difference in the number of phantom words they reported as from the left or from the right.

phantom words reported

Average number of phantom words reported for each sequence, classified by the direction from which the phantom word appeared. The data from the backward-facing subjects are here presented.

Figure 3 shows the results for the backward-facing subjects. The righthanders again reported more phantom words as coming from the right, and this difference in perceived location was again significant. And again, the non-righthanders showed no difference in the number of phantom words they reported as coming from the left or from the right.

So this study confirmed our surmise that righthanders would tend to hear more phantom words as from the right side of space, which for them is represented primarily in the left hemisphere. It further implies that, in righthanders, the left hemisphere is more involved in constructing meaning from ambiguous speech sounds.

Footnote
For an extended discussion of the ‘Phantom Words’ illusion, see Deutsch, D. (2019) Musical illusions and phantom words: How music and speech unlock mysteries of the brain,. Oxford University Press. https://global.oup.com/academic/product/musical-illusions-and-phantom-words-9780190206833

3pID2 – Communication Between Native and Non-Native Speakers

Melissa Baese-Berk mbaesebe@uoregon.edu

1290 University of Oregon
Eugene, OR 97403

Popular version of 3pID2
Presented Wednesday afternoon, December 4, 2019
178th Meeting of the Acoustical Society of America, San Diego, CA

Communication is critically important in society. Operations of business, government, and the legal system rely on communication, as do more personal ventures like human relationships. Therefore, understanding how individuals understand and produce speech is important to understand how our society functions. For decades, researchers have asked questions about how people produce and perceive speech. However, the bulk of this prior research has used an idealized, monolingual speaker-listener as it’s model. Of course, this model is unrealistic in a society where, globally, most individuals speak more than one language and frequently communicate in a language that is not their native language. This is especially true with the rise of English as a lingua franca, or common language of communication – currently, non-native speakers of English outnumber native speakers of the language.

Real-world communication between individuals who do not share a language background (e.g., a native and a non-native speaker of English) can result in challenges for successful communication. For example, communication between individuals who do not share a native language background can be less efficient than communication between individuals who do share a language background. However, the sources of those miscommunications are not well-understood.

For many years, research in this domain has focused on how to help non-native listeners acquire a second or third language. Indeed, an industry of language teaching and learning apps, classes, and tools has developed. However, only in the last decade has research on how a native listener might improve their ability to understand non-native speech begun to expand rapidly.

It has long been understood that myriad factors (both social and cognitive) impact how non-native languages are learned. Our recent work demonstrates that this is also true when we ask how native listeners can better understand non-native speech. For example, a variety of cognitive factors (e.g., memory abilities) can impact how listeners understand unfamiliar speech in general. However, it is also the case that social factors, such as listeners’ attitudes, also impact perception of and adaptation to unfamiliar speech. By better understanding these factors, we can improve education and dialog around issues of native and non-native communication. This has implications for businesses and governmental organizations dealing with international communication, as well as individuals who work across language boundaries in their professional or personal relationships.

In this talk, I address issues of communication between native and non-native speakers in their capacities as speakers and listeners. Specifically, I describe the current state of knowledge about how non-native speakers understand and produce speech in their second (or third) language, how native speakers understand non-native speech, and how both parties can improve their abilities at these tasks. I argue that awareness of the issues informing communication between native and non-native speakers is required to truly understand the processes that underlying speech communication, broadly.

4pSC34 – Social contexts do not affect how listeners perceive personality traits of gay and heterosexual male talkers

Erik C. Tracy – erik.tracy@uncp.edu
University of North Carolina Pembroke
Pembroke, NC 28372

Popular version of Poster 4pSC34
Presented in the afternoon on Thursday, December 5, 2019
178th ASA Meeting, San Diego, CA

Researchers found that different social contexts change how listeners perceive a talker’s emotional state.  For example, a scream while watching a football game could be perceived as excitement, while a scream at a haunted house could be perceived as fear.  The current experiment examined whether listeners would strongly associate certain personality traits with a talker if they knew the talkers’ sexual orientation (i.e., greater social context) compared to if listeners did not know the talkers’ sexual orientation (i.e., less social context).  For example, if a listener knew that a talker was gay, they may perceive the talker as being more outgoing.  In the first phase of the experiment, listeners heard a gay or heterosexual male talker and then they rated, along a 7-point scale with 7 being the strongest, how much they associated the talker with a personality trait.  Here, listeners did not know the talkers’ sexual orientation.  It was found that listeners associated certain personality traits (e.g., confident, mad, stuck-up, and outgoing) with gay talkers and other personality traits (e.g., boring, old, and sad) with heterosexual talkers.  The second phase of the experiment was similar to the first phase, but the key difference was that the listeners were aware of the talkers’ sexual orientation.  For instance, listeners heard a gay or heterosexual talker and then rated the talker along the 7-point scale.  On each trial, the talker’s sexual orientation was presented next to the 7-point scale.  The results of the second phase were similar to the results from the first phase.  If listeners knew the talkers’ sexual orientation, they still perceived gay talkers as being more confident, mad, stuck-up, and outgoing, and they still perceived heterosexual talkers as being more boring, old, and sad.  As an example, the Outgoing chart shows how listeners responded if they knew or did not know the talkers’ sexual orientation when deciding how outgoing the talker was.

Social contexts

In conclusion, if listeners knew the talkers’ sexual orientation (i.e., greater social context), then this did not strengthen associations between gay and heterosexual talkers and certain personality traits.

3pBA4 – Artificial Intelligence for Automatic Tracking of the Tongue in Real-time Ultrasound Data

M. Hamed Mozaffari – mmoza102@uottawa.ca
Won-Sook Lee – wslee@uottawa.ca
School of Electrical Engineering and Computer Science (EECS)
University of Ottawa
800 King Edward Avenue
Ottawa, Ontario, Canada K1N 6N5

David Sankoff – sankoff@uottwa.ca
Department of Mathematics and Statistics
University of Ottawa
150 Louis Pasteur Pvt.
Ottawa, Ontario K1N 6N5

Popular version of papers 3pBA4
Presented Wednesday afternoon, December 4, 2019
178th ASA Meeting, San Diego, CA

Medical ultrasound technology has been a well-known method in speech research for studying of tongue motion and speech articulation. The popularity of ultrasound imaging for tongue visualization is because of its attractive characteristics such as imaging at a reasonably rapid frame rate, which allows researchers to visualize subtle and swift gestures of the tongue during the speech in real-time. Moreover, ultrasound technology is relatively affordable, portable and clinically safe with a non-invasive nature.

Exploiting the dynamic nature of speech data from ultrasound tongue image sequences might provide valuable information for linguistics researchers, and it is of great interest in many recent studies. Ultrasound imaging has been utilized for tongue motion analysis in the treatment of speech sound disorders, comparing healthy and impaired speech production, second language training and rehabilitation, to name a few.

During speech data acquisition, an ultrasound probe under the user’s jaw pictures tongue surface in midsagittal or coronal view in real-time. Tongue dorsum can be seen in this view as a thick, long, bright, and continues region due to the tissue-air reflection of ultrasound signal by the air around the tongue. Due to the noise characteristic of ultrasound images with the low-contrast property, it is not an easy task for non-expert users to localize the tongue surface.

tongue

Picture 1: An illustration of the human head and tongue mid-sagittal cross-section view. The tongue surface in ultrasound data can be specified using a guide curve. Highlighted lines (red and yellow) can help users to track the tongue in real-time easier.

To address this difficulty, we proposed a novel artificial intelligence method (named BowNet) for tracking the tongue surface in real-time for non-expert users. Using BowNet, users can see a highlighted version of their tongue surface in real-time during a speech without any training. This idea of tracking tongue using a contour facilitates linguistics to use the BowNet technique for their quantitative studies.

Performance of BowNet in terms of accuracy and automation is significant in comparison with similar methods as well as the capability of applying on different ultrasound data types. The real-time performance of the BowNet enables researchers to propose new second language training methods. The better performance of BowNet techniques is presented in Video 1.

Video1: A performance presentation of BowNet models in comparison to similar recent ideas. Better generalization over different datasets, less noise, and better tongue tracking can be seen. Failure cases with colour are indicated in video.

2pAA13 – Reverberation Time Slope Ratio Thesis

Michael Fay – mfay.gracenote@gmail.com
GraceNote Design Studio
7046 Temple Terrace St.
San Diego, CA 92119

Presented Tuesday afternoon, December 3, 2019
178th ASA Meeting, San Diego, CA

The T60 Slope Ratio thesis defines specific reverberation time vs. frequency goals for modern architectural acoustic environments. It is offered to advance and define a room’s acoustic design goals, and provide a simple numeric scoring scale, and adjunct grade, from which acoustical design specifications can be initiated and/or evaluated. The acronym for reverberation time is T60.

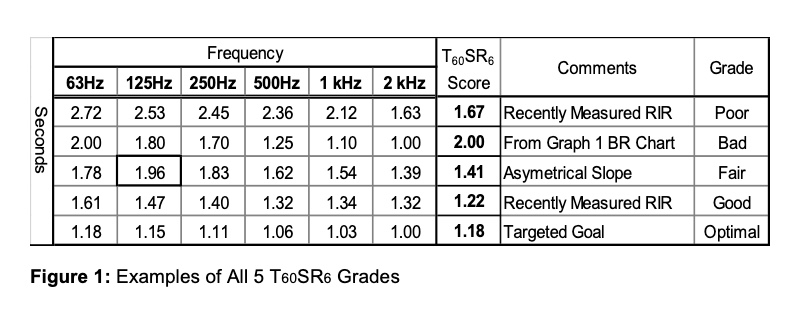
The thesis outlines a proposed standard that condenses six octaves (63 Hz – 2 kHz) of reverberant decay-time data into a single numeric score for grading indoor performance, worship and entertainment facilities. Specifically, it’s a defining metric for scoring and grading the relationship (i.e. ratio) between the longest and shortest of the six T60 values — be they measured or predicted.

Beranek’s classical Bass Ratio goals and calculations were developed to support the idea that acoustic instruments need a little extra support, via longer reverberation times, in the low-frequency range.

The modern T60 Slope Ratio goals and calculations advance the notion that those same low frequencies don’t require extra time, but rather need to be well contained. Longer low and very low-frequency (VLF) T60s are not needed or desirable when an extended-range sound reinforcement system is used.

Slope Ratio

Slope Ratio
Figure 2: Graphic Examples of 5 T60 Measurements

The T60 Slope Ratio is calculated by dividing the longest time by the shortest time, regardless of frequency. An optimal score has a ratio between 1.10 and 1.20.

The proposed scoring and grading scale is defined by six numeric scoring tiers from 1.00 to 1.70 and above, and five grading adjectives from Optimal to Bad. See Figure 3.

Slope RatioThese modern applications would benefit from an optimal T60SR6 grade:
♣ Performing Arts Venues
♣ Contemporary Worship Facilities
♣ Venues with Electro-acoustical Enhancement Systems
♣ Large Rehearsal Rooms

Modern VLF testing standards and treatments are lacking:
♣ The ANSI and ISO standards organizations need to develop new guidelines and standards for testing VLF absorption products and integration options.
♣ Manufacturers should make new VLF treatment products an R&D priority.

More than one hundred years ago Walter Sabine, the father of classical architectural acoustics, was concerned that music halls would soak up too much of the low-frequency energy being produced by acoustic instruments, causing audiences to complain that the music lacked body. However today, most musical styles, venues, technology, and consumer tastes and expectations have advanced far beyond anything relevant to Sabine’s concern.

The Slope Ratio Postulate: Modern loudspeakers are designed and optimized to perform as flat, or nearly flat, audio output devices. Therefore, why aren’t acousticians designing a nearly-flat T60 response for rooms in which these loudspeakers operate?