1aBAb2 – Transcranial Radiation of Guided Waves for Brain Ultrasound

Eetu Kohtanen – ekohtanen3@gatech.edu
Alper Erturk – alper.erturk@me.gatech.edu
Georgia Institute of Technology
771 Ferst Drive NW
Atlanta, GA 30332

Matteo Mazzotti – matteo.mazzotti@colorado.edu
Massimo Ruzzene – massimo.ruzzene@colorado.edu
University of Colorado Boulder
1111 Engineering Dr
Boulder, CO 80309

Popular version of paper ‘1aBAb2’
Presented Tuesday morning, June 8, 2021
180th ASA Meeting, Acoustics in Focus

Ultrasound imaging is a safe and familiar tool for producing medical images of soft tissues. Ultrasound can also be used to ablate tumors by focusing a large amount of acoustic energy (“focused ultrasound”) capable of destroying tumors.

The use of ultrasound in the imaging and treatment of soft tissues is well established, but ultrasound treatment for the brain poses important scientific challenges. Conventional medical ultrasound uses bulk acoustic waves that travel directly through the skull into the brain. While the center of the brain is relatively accessible in this way to treat disorders such as essential tremor, the need for transmitting waves to the brain periphery or the skull-brain interface efficiently (with reduced heating of the skull) motivates research on alternative methods.

The skull is an obstacle for bulk waves, but for guided waves it presents opportunity. Unlike bulk waves, guided (Lamb) waves propagate along structures (such as the skull), rather than through them—as the name suggests, their direction of travel is guided by structural boundaries.  If these guided waves are fast enough, they “leak” into the brain efficiently. However, there are challenges due to the complex skull geometry and bone porosity. Our research seeks a fundamental understanding of how guided waves in the skull radiate energy into the brain to pave the way for making guided waves a viable medical ultrasound tool to expand the treatment envelope.

To study the radiation of guided waves from skull bone, experiments were conducted with submersed skull segments. A transducer emits pressure waves that hit the outer side of the bone, and a hydrophone measures the pressure field on the inner side. In the following animation, the dominant guided wave radiation angle can be seen as 65 degrees. With further data processing, the experimental radiation angles (contours) are obtained with frequency. Additionally, a numerical model that considers the separate bone layers and the fluid loading is constructed to predict the radiation angles of a set of different guided wave types (solid branches). The experimental contours are always accompanied by corresponding numerical prediction, validating the model.

Experimental pressure field on the inner side of the skull bone segment and the corresponding radiation angles

With these results, we have a better understanding of guided wave radiation from the skull bone. The authors hope that these fundamental findings will eventually lead to application of guided waves for focused ultrasound in the brain.

2aNS3 – A Socio-Technical Model for Soundmapping Community Airplane Noise

Tae Hong Park – thp1@nyu.edu
New York University
New York, NY 10011

Popular version of paper 2aNS3 A socio-technical model for soundmapping community airplane noise
Presented Wednesday morning, June 9, 2020
180th ASA Meeting, Acoustics in Focus

Airports are noisy. Neighborhoods around airports are noisy. Airports around the world typically rely on theoretical noise models to approximate noise levels around airports. While the models render reasonable noise conditions, when closely looking at geospatial data, a different picture emerges. In Chicago, for example, airplane noise complaints have increased from approximately 15,000 per year in 2009 to 5,500,000 per year in 2017. In urban centers like New York, 10% of persons looking to rent or buy a home in Queens will hear near-constant roar of low-flying planes at their property; and in Flushing, 66% of listings are in “airport noise zones” as of June 2019.

While numbers tell a certain kind of story, they sometimes poorly capture human experiences. In the case of aerial sonic pain, it is perhaps even more difficult to relate to as noise is invisible, odorless, and shapeless. And unless one lives in such a neighborhood, how would one really know? And this is exactly what we were thinking which led us to visit neighborhoods around major airports in Chicago and New York with an open mind (ear?). The experience was shocking (wrote a piece for 140 speakers shortly thereafter!).

Since that first visit, we have been “putting the metal to the pedal” in accelerating the development of a socio-technical sound sensor network called Citygram that would make practicable measuring actual noise levels opposed to theoretical noise levels around airports. The project, launched 10 years ago, has also recently developed into a startup called NOISY to empower communities to track airplane noise around their homes.

citygram

Citygram Globe Interface showing sound level bars

citygram

Citygram heatmap interface

NOISY is essentially a low-cost, automatic aircraft noise tracking system using state-of-the-art AI and a smart sound sensor network. The NOISY sensor ignores non-airplane sounds such as dog barks, honking sounds, and loud music while identifying airplanes flying near your home, associating it with essential information such time-stamped decibel levels, position, and speed.

One of the key elements, apart from the technological advancements is that the sensors do not archive any audio nor is any audio sent to the cloud: only information such as how loud (decibels) and aircraft probability (0%-100%) is extracted from the audio, thus minimizing privacy concerns.

Theoretical noise models, are just that – models. And not knowing the actual aircraft noise levels that communities experience is problematic, especially in the context of developing meaningful mitigation efforts. That is, “you can’t fix what you can’t measure” and that is precisely what we are aiming to contribute to – a quieter future informed by measured data.

For more information on:
Citygram please visit: https://citygramsound.com
NOISY please visit: https://www.getnoisy.io

1aSPa4 – The Sound of Drones

Valentin V. Gravirov –  vvg@ifz.ru
Russian Federation
Moscow 123242

Popular version of paper 1aSPa4
Presented Tuesday morning, June 8, 2021
180th ASA Meeting, Acoustics in Focus

Good afternoon, dear readers! I represent a research team from Russia and in this brief sci-pop summary, I would like to tell you about the essence of the work carried out recently. Our main goal was to study the sound generated by drones during flight in order to solve the problems of their automatic finding and recognition. It’s no secret that unmanned aerial vehicles or drones are now developing and progressing extremely fast. The drones are beginning to be used everywhere, for example, for filming, searching for missing people, delivery of documents and small packages. Obviously, over time, the number of tasks completed and the number of unmanned aerial vehicles will continue to increase. This will inevitably lead to an increase in the number of collisions in the air >.

Last year, as part of our expedition to the Arctic region, we personally encountered a similar problem.

Our expeditionary team used two drones to photograph a polar bear, which nearly caused them to collide. That is, two quadrocopters almost collided in circumstances when there was no other drone within a radius of a thousand kilometers. Imagine the danger of air traffic, when many devices are flying nearby? Within the framework of civilian use, such a problem can be solved by using active radio beacons on drones, but in official use, for example, in military tasks, it is obvious that such systems will be unacceptable. To solve such problems, a large number of optical systems for recognizing drones have already been created, but they do not always give a accurate results and often significantly depend on weather conditions or the time of day. That is why our research group has set itself the goal of studying the acoustic noise generated by unmanned aerial vehicles, this will allow us to find new ways to solve the urgent problem of detecting and determining the location of drones.

In the course of the experiments, the sound generated by typical electric motors of drones with the installation of propellers with different numbers of blades were studied in detail. The analysis of the results obtained allowed us to conclude that the main factor to the noise is created by the rotational speed of the blades, which is equal to the rotational speed of the engine shaft, multiplied by the number of blades. At the same time, due to the presence of small defects in the blades, the sound of each specific blade are slightly different. The studies also examined the noise generated by two popular household drone models DJI Mavic

household drone
Used household drone models DJI Mavic.  in dense urban environments with high levels of urban acoustic noise. It was found that at distances exceeding 30 meters, the acoustic signal level disappears in the background to urban noise, which can be explained by the small size and small power of the models studied. Undoubtedly, outside the city or in a quiet place, the detection range of drones will be significantly greater. In the course of the experiments, it was found that the main sound generated by drones lie in the frequency range 100 – 2000 Hz


In addition to field experiments, mathematical modeling was also carried out, the results of which coincide with the obtained experimental data. An algorithm based on the use of artificial neural networks technology has been developed for automated recognition of drones. At the current time, the algorithm allows detecting a drone with a 94% accuracy. Unfortunately, the probability of false positives is still high and amounts to about 12%. This will require us to carry out in the near future both additional research and work on a significant improvement of the recognition algorithm.

2aSC8 – Tips for collecting self-recordings on smartphones

Valerie Freeman – valerie.freeman@okstate.edu
Oklahoma State University
042 Social Sciences & Humanities
Stillwater, OK 74078

Popular version of paper 2aSC8 Tips for collecting self-recordings on smartphones
Presented Wednesday morning, June 9, 2021
180th ASA Meeting, Acoustics in Focus

When the pandemic hit, researchers who were in the middle of collecting data with people in person had to find another way. Speech scientists whose data consists of audio recordings of people talking switched to remote methods like Zoom or asking people to record themselves on their phones. But this switch came with challenges. We’re used to recording people in our labs with expensive microphones, in quiet sound booths where we can control the background noise and how far away our talkers sit from the mic. We worried that the audio quality from smartphones or Zoom wouldn’t be good enough for the acoustic measures we take. So, we got creative. Some of us did tests to verify that phones and Zoom are okay for our most common measurements (Freeman & De Decker, 2021; Freeman et al., 2020), some devised ways to test people’s hardware before beginning, some delivered special equipment to participants’ homes, and others shifted their focus to things that didn’t require perfect audio quality.

A photo of professional recording equipment in a laboratory sound booth – how speech scientists usually make recordings.

For one study in the Sociophonetics Lab at Oklahoma State University, we switched to having people record themselves on their phones or computers, and three weeks later, we had 50 new recordings – compared to the 10 we’d recorded in person over three weeks pre-pandemic! The procedure was short and simple: fill out some demographics, start up a voice recording app, read some words and stories aloud, email me the recording, and get a $5 gift card.

Along the way, we learned some tricks to keep things running smoothly. We allowed people to use any device and app they liked, and our instructions included links to some user-friendly voice memo apps for people who hadn’t used one before. The instructions were easy to read on a phone, and there weren’t too many steps. The whole procedure took less than 15 minutes, and the little gift card helped. We asked participants to sit close to their device in a quiet room with carpet and soft furniture (to reduce echo) and no background talking or music. To make it easier for older folks, I offered extra credit to my classes to help relatives get set up, we included a link to print the words to read aloud, and we could even walk people through it over Zoom, so we could record them instead.

And it worked! We got over 100 good-quality recordings from people all over the state – and many of them never would have come to the lab on campus, making our study more representative of Oklahoma than if we’d done it all in person.

While this year has been challenging, the ways researchers have learned to use consumer technology to collect data remotely will be an asset even after the pandemic subsides. We can include more people who can’t come to campus, and researchers with limited resources can do more with less – both of which can increase the diversity and inclusiveness of scientific research.

self-recordings

An image of the Sociophonetics Lab logo

See more about the Sociophonetics Lab at sophon.okstate.edu.

3pEA6 – Selective monitoring of noise emitted by vehicles involved in road traffic

Andrzej Czyżewski
Gdansk University of Technology
Multimedia Systems Department
80-233 Gdansk, Poland
www.multimed.org
E-mail: ac@pg.edu.pl

Tomasz Śmiałkowski
SILED Co. Ltd.
83-011 Gdańsk Poland
http://siled.pl/en/
E-mail: biuro@siled.pl

Popular version of paper 3pEA6 Selective monitoring of noise emitted by vehicles involved in road traffic
Presented Thursday afternoon, June 10, 2021
180th ASA Meeting, Acoustics in Focus

The aim of the project carried out by a Gdansk University of Technology in cooperation with an electronics company is to conduct industrial research, development, and pre-implementation works on a new product, namely an intelligent lighting platform.  This kind of street lamp system called infoLIGHT using a new generation of LEDs will become a smart city access point to various city services (Fig. 1).

Figure 1 Intelligent lighting platform – infoLIGHT project website

The research focuses on the electronics built in the street lamp using multiple sensors (Fig. 2), including an acoustic intensity probe that measures the sound intensity in three orthogonal directions, making it possible to calculate the azimuth and elevation angles, describing the sound source position.

Figure 2 – Road lamp design

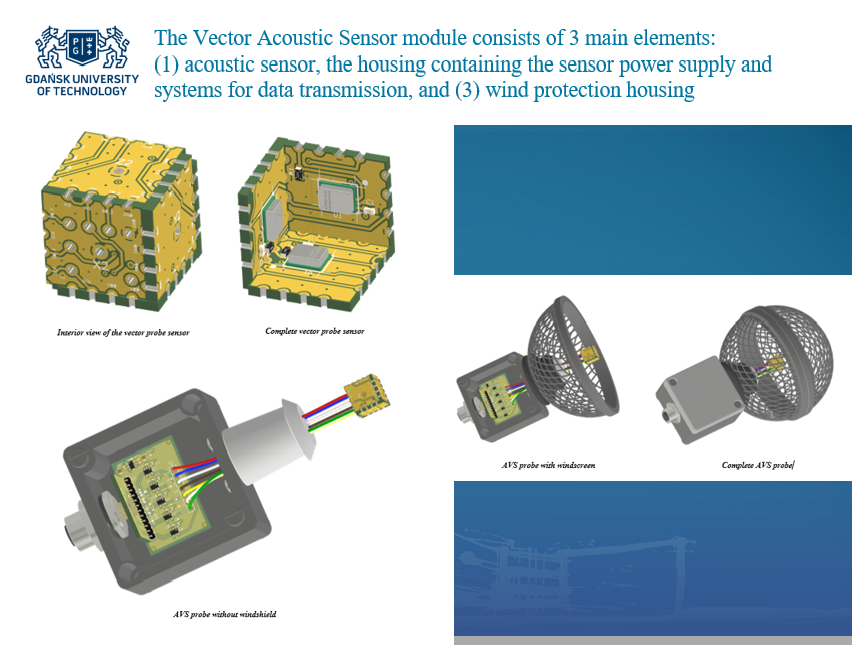
The acoustic sensor is made in the form of a cube with a side of 10 mm, on the inner surfaces of which the digital MEMS microphones are mounted (Fig. 3). The acoustic probes were mounted on the lamp posts that illuminate the roadways depending on the volume of traffic.

Figure 3 Acoustical vector sensor – construction

The algorithm works in two stages. The first stage is the analysis of sound intensity signals to detect acoustic events. The second stage analyses acquired signals based on the normalized source position; its task is to determine whether the acoustic event represents what kind of a vehicle passing the sensor and detecting its movement direction. A neural network was applied for selective analysis of traffic noise (Fig. 4). The neural network depicted in Figure 4 is the so-called 1D (one-dimensional) convolution neural network. It was trained to count vehicles passing by through the analysis of noise emitted by them.

Figure 4 Neural network applied for selective analysis of traffic noise

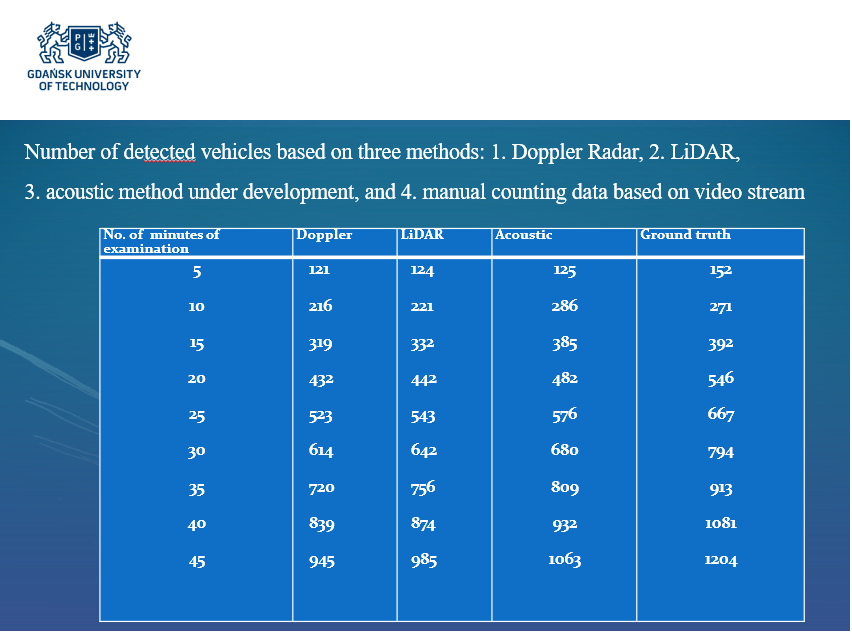
The paper presented at the ASA Meeting explains how accurately traffic can be monitored through directional noise analysis emitted by vehicles and shows the resulting application to smart cities (see Fig. 5).

Figure 5 Comparative results of traffic analysis employing various approaches

The Polish National Centre for Research and Development (NCBR) subsidizes project No. POIR.04.01.04/2019 is entitled: infoLIGHT – “Cloud-based lighting system for smart cities” from the budget of the European Regional Development Fund.

1aMU6 – Psychoacoustic phenomena in electric-guitar performance

Jonas Braasch
School of Architecture, Rensselaer Polytechnic Inst.
Troy, NY 12180
braasj@rpi.edu

Joshua L. Braasch
Trans-genre Studio
Latham, NY

Torben Pastore
College of Health Solutions
Arizona State Univ
Tempe, AZ

Popular version of paper 1aMU6 Psychoacoustic phenomena in electric-guitar performance
Presented Tuesday morning, June 8, 2021
180th ASA Meeting, Acoustics in Focus

This presentation examines how electric guitar effects helped pave the road to modern rock and roll music. Distortion effects provide sustain for the guitar similar to other core-ensemble instruments like the violin and piano in classical music. Distortion can also make the sound brighter to heighten the often aggressive sound of rock music. Other effects, like the chorus, phaser, and flanger, can help make the guitar sound much wider, something we are also used to listening to with classical orchestras. To some extent, electrical guitar effects substituted for and expanded upon the room reverberation that typically accompanies classical music, and they were instrumental in producing stereo Rock ‘n’ Roll records that provide spatial width, something old mono records do not provide. While often having favorable sound-color characteristics, the sound of mono recordings sits static in between both ears when listening through headphones or earbuds. This phenomenon, which is called inside-the-head locatedness, is not apparent when listening through a loudspeaker. Without electric sound effects, the electric guitar would not have become the distinctive instrument that Jimi Hendrix, Link Wray, Chuck Berry, and others defined.


Figure 1: Schematic depicting the stereo image (left/right balance) for examplary stereo recordings. Left: In Jazz albums like Miles Davis’ Kind of Blue, placing instruments to the left, center, or right worked well because of the transparent sound ideal of the genre; Center: Early rock/pop songs like the Beatles’ “Helter Skelter” used the same approach with less success; Right: Electronic effects later made it possible to widene the instrument sounds like it is the case for Nirvana’s “Smells like teen spirit” — reflecting the genre’s sound ideal to perceptually fuse sounds together.

A brief survey was conducted to investigate the extent to which electrical sound effects provide a desirable guitar sound beyond the sustain and spatial qualities these effects can provide. The outcome for a group of 21 participants (guitarist and non-guitarists) suggests that listeners have their distinct preferences when listening to a blues solo. It appears that they prefer some but not all distortion effects over a clean, non-distorted sound.


Figure 2: Guitar effects used in the listening survey


Figure 3: Results of the listening survey. The average preference over 21 listener is shown as a function of 10 different guitar distortion effects that were used in the survey. Three percpetually distinct groups were found.  Two effects rated significantly higher than the other eight, and one effect was rated significantly lower than all other ones. The clean (no effect) condition was in the center group, so dependent on the type of distortion, the effect can make the guitar sound better or worth.